
Super Funds -Updated To March 2023
APRA and ATO (SMSF Data) released their funds data earlier this week and we have delved into some of the details. Note: The SMSF data is currently available to all See SMSF Dashboard Here - while the APRA fund data is only in our Members Lounge - Join Here.
At the SMSF level, we have provided a summary of key points on the opening page. This includes the following:
Opportunity for advisers continues to grow - albeit more slowly. This is due to the number of advisers leveling out over recent times, and the slowing growth of SMSFs.
The average balance per member - Now at $752,504. Slightly up on last quarter which was $750,246, but down from its peak of $792,701 recorded for March 2022.
Windups - What windups? - The last 3 quarters of SMSF windups has been very low whereas establishments have been reasonably consistent. Much of this could simply be an administrative issue and the next set of figures for June will be interesting to watch.
At the APRA Fund level, for which we have included some of our SMSF and adviser stats, there are some interesting movements. Dashboard Number (D#) shown for each comment. Note: The dashboards are interactive and allow the user to select alternate dates and comparisons.
D1 - Opportunity for advisers - Growing. The total super assets divided by the number of advisers comes in at $211 mil per adviser compared to $205 last quarter. Back at the start of 2019 it was only $88 mil per adviser. This was when we reached the peak number of advisers at 27,930.
D2 - SMSFs as a share of total super assets is at 26% - Has hovered between 25 and 27% since the records became available in 2017
D2 - Industry Funds are out in front with 34% of total assets - after being in fourth position in 2017 at 22%. Most of their gains have come in recent years as they swallowed up some Public Funds and gained market share from Retail Funds post the Royal Commission
D3 - Five year returns favour Industry Funds at 6.2% - Public Funds at 5.6% and Retail at 4.8%. The returns may be a combination of lower fees and asset allocation - see later
D5 - Net Contributions for Retail Funds dipped into the red at (-$0.71 bil) - The last time they were in the red was Sep 2021. Industry Fund net flows dropped slightly but are still strong at $13.29 bil
D9 - Fees as a % of total assets continue to fall - On a quarterly level, Industry Funds are at 0.11% and Retail Funds at 0.17%. On a rolling 12 months, Industry Funds are at 0.48% and Retail at 0.71%. Back in 2012, both were very similar at 0.84% for Industry Funds and 0.85% for Retail.
Investment - Assets Allocations - Dashboard 10
Returns are often determined by the allocation of investments. The charts below highlight that the three main funds hold different strategies. Retail and Industry Funds are at the extreme while Public Funds tend to hover in-between them.
Top Chart Key Assets (APRA broad category of assets) - Retail have the highest allocation to equities and cash. Industry Funds still have a high allocation to equities but proportionately, a much higher share of infrastructure assets.
Lower Chart Unlisted Assets - Industry and Public Funds have a much higher proportion of unlisted assets, nudging 22%, whereas as Retail Funds only have 4.5% or less than 1/5th of the other two funds.

Retail Funds highest for Equities and Cash. Industry and Public Funds have a greater share of Property and Infrastructure.
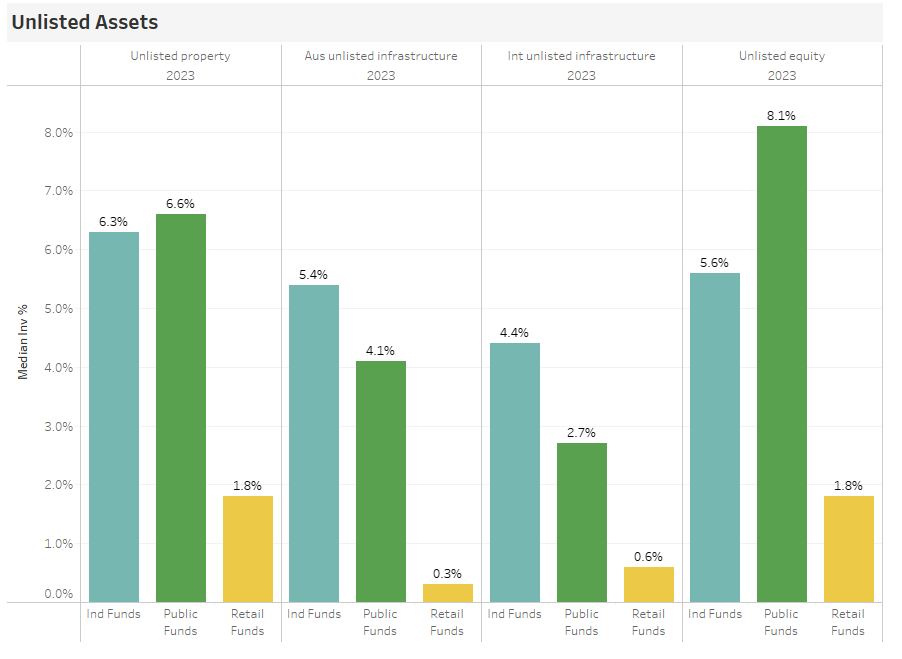
Unlisted Assets - Industry Funds total at 21.7%, Public Funds at 21.5% and Retail Funds at only 4.5%
The issue of listed and unlisted assets have been a talking point for many years. Some people believe that unlisted assets can have some serious issues in terms of liquidity and valuations. Others believe that such assets can make the difference between great and good returns over the long term.
Some debate with regards to the pros and cons of holding unlisted versus listed assets could be valued by all, especially the end consumer for determining which fund they should invest their hard earned super.